")
")
Read-IT
An open place to share expertise, information, opinions and insights on new trends in management control, corporate finance, business intelligence, analytics and web development. All screenshots © of their respective owners.
Wednesday, 05 April 2017 13:48
Dynistics Dashboards
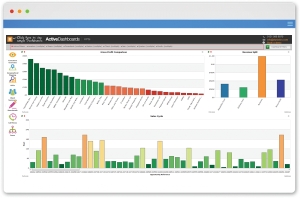
Dynistics has created a professional, easy-to-install, industry-leading graphical, dashboard reporting solution. This provides executives and operational staff with graphical reports delivered directly to their desktop browser, that helps align operational decisions with the achievement of goals at every level of the organisation.
Active Dashboards is a new approach to reporting results and predicting future outcomes, bringing together all of the elements needed to deliver a solution that reflects the dynamic, data-driven business in which most organisations are required to operate. The company also offers a dynamic way to deliver and share key information throughout the organisations: Active Scoreboards.
More information on Dynistics website. A demo dashboard gallery is here.
Published in
analytics
Wednesday, 22 March 2017 18:50
Periscope Data
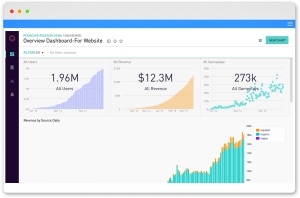
Periscope Data is a comprehensive data analysis platform. It is a tool that brings to companies all the relevant and important information at one place, which gives a complete view of business performances. It enables real-time better decision making for organizations.
Periscope Data was introduced in San Francisco and it was developed by a strong and skilled team. Periscope Data helps to visualize some of the key aspects of the business. Highly interactive and intuitive graphic displays accompanied by filters can be a big help to check out how managers can bring about improvements in their business decisions. Dashboards creation is also easy and effective.
More information available on the Periscope website. The product is also SOC 2 and HIPAA compliant.
Published in
controlling
Wednesday, 22 March 2017 18:38
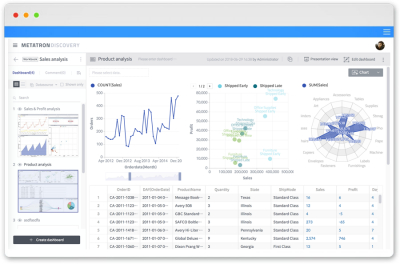
Sisense
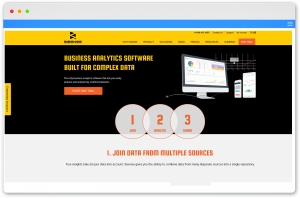
Forget about data warehouses, OLAP cubes and star schemas. Sisense lets you create and manage complex data models from multiple sources in a simple drag & drop environment anyone can understand. See your data come to life in interactive web dashboards with a host of stunning visualization options. Explore all your data from any angle and at any granularity to reach real insights, fast.
Sisense Inc. is based in New York and Tel Aviv.
More information on Sisense website.
Sisense Inc. is based in New York and Tel Aviv.
More information on Sisense website.
Published in
analytics
Categories
Search
© 2002 - 2024 Frêney | Freney, S.r.l. - P.Iva: IT03001860166