")
")
Read-IT
An open place to share expertise, information, opinions and insights on new trends in management control, corporate finance, business intelligence, analytics and web development. All screenshots © of their respective owners.
Wednesday, 31 October 2018 09:13
Smashing framework
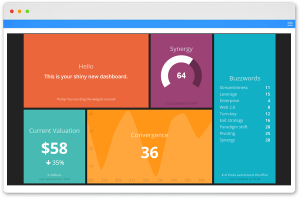
Smashing is a Sinatra based framework, used to build beautiful and impressive dashboards. The project is a fork of Dashing, an excellent framework created by Shopify for displaying custom dashboards on TVs around their offices.
Smashing has a drag & drop interface for re-arranging the widgets positions and many premade widgest, ready to be used. Developers can also build custom widgets, to display data from multiple sources (Simple Ruby DSL for fetching data from databases or online resources).
The official Smashing page is here →.
Here is a live demo → of a simple dashboard with realtime update. You can host your Smashing dashboards on Heroku in less than 30 seconds.
Published in
controlling
Friday, 19 October 2018 09:08
Grafana dashboards
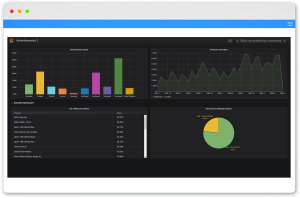
Grafana provides a powerful and elegant way to create, explore, and share dashboards and data with teams and on the world wide web. It is most commonly used for visualizing time series data but many use it in other domains including business analytics, industrial sensors, weather forecasting and process control.
Grafana works with Graphite, Elasticsearch, Cloudwatch, Prometheus, InfluxDB & many more data sets, included MySQL, PostgreSQL, Microsoft SQL Server, etc. Grafana is open source software, but if offers some commercial plugins to add some useful features.
More info here.
Grafana works with Graphite, Elasticsearch, Cloudwatch, Prometheus, InfluxDB & many more data sets, included MySQL, PostgreSQL, Microsoft SQL Server, etc. Grafana is open source software, but if offers some commercial plugins to add some useful features.
More info here.
Published in
controlling
Wednesday, 10 October 2018 13:46
Query2Report analytics
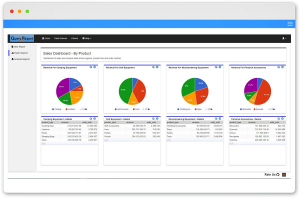
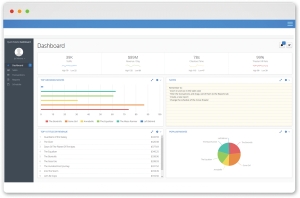
Query2Report is a simple opensource business intelligence solution that allows users to build reports and dashboards for data analytics or corporate reporting. The application transforms SQL queries to beautiful and very impressive Google charts. The application offers automatic refresh functionality for nearly real-time reporting.
The different elements in reports can pull data from multiple databases instance belonging to same or different vendor.
A role based security allows the administrators to create public reports and personal workspaces. Angular JS is used to build this application with a responsive user interface design. It run on laptops, mobiles and tablets.
These are the main features:
More information available here:
https://sourceforge.net/projects/query2report/
where you can also find the download link.
Last version issued on August 4th 2018.
The different elements in reports can pull data from multiple databases instance belonging to same or different vendor.
A role based security allows the administrators to create public reports and personal workspaces. Angular JS is used to build this application with a responsive user interface design. It run on laptops, mobiles and tablets.
These are the main features:
- web based reporting and dashboard generator
- auto refresh for real-time reporting
- public and personal report workspaces
- integrates with any database using JDBC connections
- role based user access
More information available here:
https://sourceforge.net/projects/query2report/
where you can also find the download link.
Last version issued on August 4th 2018.
Published in
analytics
Friday, 30 March 2018 07:27
Leonardo dashboards
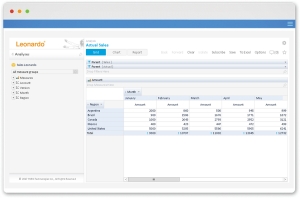
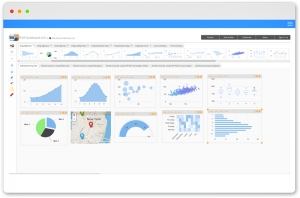
Leonardo by Paris Technologies Inc. delivers dashboards that are not only visually beautiful, but also alive. This means that all information from Leonardo are connected to the actual source of data (OLAP or 3rd party systems). Therefore, data is dynamically refreshed in real-time, from the source.
Leonardo is a web application that is installed on any Windows operating system machine that includes a web server, which delivers Business Intelligence content for your Microsoft-based BI environment to authorized users.
Users can access Leonardo from intranet or internet, depending on environment configuration.Leonardo is a web application that is installed on any Windows operating system machine that includes a web server, which delivers Business Intelligence content for your Microsoft-based BI environment to authorized users.
It takes 5 minutes to download and install Leonardo, for the first time or as a software upgrade.Leonardo is a web application that is installed on any Windows operating system machine that includes a web server, which delivers Business Intelligence content for your Microsoft-based BI environment to authorized users.
Leonardo is accessible from various web browsers and has an intuitive interface that is easy to adopt.Leonardo is a web application that is installed on any Windows operating system machine that includes a web server, which delivers Business Intelligence content for your Microsoft-based BI environment to authorized users.
Interactive dashboards can be accessed from desktop or mobile devices.Leonardo is a web application that is installed on any Windows operating system machine that includes a web server, which delivers Business Intelligence content for your Microsoft-based BI environment to authorized users.
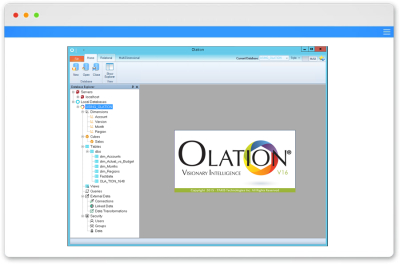
Leonardo is also an OLAP client that can access, browse, and analyze OLAP data and create OLAP reports for multidimensional Olation™ models. Users quickly create interactive business dashboards using already created OLAP analysis or using MDX and SQL queries. Leonardo has features to create and maintain your organization’s KPIs. Users can subscribe to receive dashboard and OLAP analysis at scheduled times.
More details here. Leonardo is offered in the Leonardo suite V18.
Leonardo is a web application that is installed on any Windows operating system machine that includes a web server, which delivers Business Intelligence content for your Microsoft-based BI environment to authorized users.
Users can access Leonardo from intranet or internet, depending on environment configuration.Leonardo is a web application that is installed on any Windows operating system machine that includes a web server, which delivers Business Intelligence content for your Microsoft-based BI environment to authorized users.
It takes 5 minutes to download and install Leonardo, for the first time or as a software upgrade.Leonardo is a web application that is installed on any Windows operating system machine that includes a web server, which delivers Business Intelligence content for your Microsoft-based BI environment to authorized users.
Leonardo is accessible from various web browsers and has an intuitive interface that is easy to adopt.Leonardo is a web application that is installed on any Windows operating system machine that includes a web server, which delivers Business Intelligence content for your Microsoft-based BI environment to authorized users.
Interactive dashboards can be accessed from desktop or mobile devices.Leonardo is a web application that is installed on any Windows operating system machine that includes a web server, which delivers Business Intelligence content for your Microsoft-based BI environment to authorized users.
Leonardo is also an OLAP client that can access, browse, and analyze OLAP data and create OLAP reports for multidimensional Olation™ models. Users quickly create interactive business dashboards using already created OLAP analysis or using MDX and SQL queries. Leonardo has features to create and maintain your organization’s KPIs. Users can subscribe to receive dashboard and OLAP analysis at scheduled times.
More details here. Leonardo is offered in the Leonardo suite V18.
Published in
analytics
Tuesday, 16 May 2017 13:08
Dashing framework
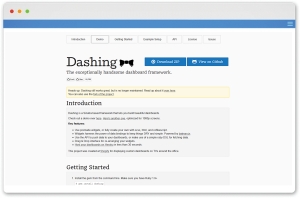
Dashing is a mature dashboard framework, based on Sinatra, used to build very beautiful dashboards. It's frequently used to display dashboards on TV screens in offices.
Here are the main features:
Example 1 link - Example 2 (TV screen) link
More information on the project website.
Here are the main features:
- use premade widgets, or fully create your own with scss, html, and coffeescript
- widgets harness the power of data bindings to keep things simple. Powered by batman.js
- use the API to push data to your dashboards, or make use of a simple ruby DSL for fetching data
- drag & Drop interface for re-arranging your widgets
- host your dashboards on Heroku in less than 30 seconds
Example 1 link - Example 2 (TV screen) link
More information on the project website.
Published in
other
Saturday, 15 April 2017 08:42
WSO2 Smart Analytics
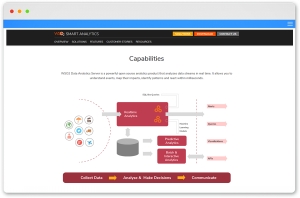
WSO2 Smart Analytics is a very robust open source analytics platform. With Smart Analytics you can utilize batch analytics for historical analysis, interactive analysis for running complex queries across multiple datasets, and use machine learning models for predictive analysis.
It is also a dashboard tool, with the ability to record events and the ability to track operational metrics, to create powerful visualizations for management.
More information available on WSO2 website.
Direct download link is here.
It is also a dashboard tool, with the ability to record events and the ability to track operational metrics, to create powerful visualizations for management.
More information available on WSO2 website.
Direct download link is here.
Published in
analytics
Wednesday, 05 April 2017 13:48
Dynistics Dashboards
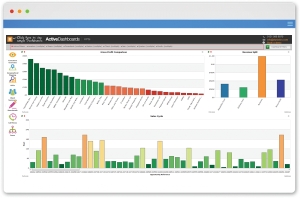
Dynistics has created a professional, easy-to-install, industry-leading graphical, dashboard reporting solution. This provides executives and operational staff with graphical reports delivered directly to their desktop browser, that helps align operational decisions with the achievement of goals at every level of the organisation.
Active Dashboards is a new approach to reporting results and predicting future outcomes, bringing together all of the elements needed to deliver a solution that reflects the dynamic, data-driven business in which most organisations are required to operate. The company also offers a dynamic way to deliver and share key information throughout the organisations: Active Scoreboards.
More information on Dynistics website. A demo dashboard gallery is here.
Published in
analytics
Wednesday, 05 April 2017 12:15
InetSoft's Style Scope™
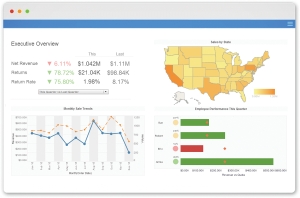
InetSoft's Style Scope™ is an easy to use interactive dashboard solution that includes real time reporting capabilities. It is an edition of Style Intelligence that focuses on business data monitoring and exploration by combining a data intelligence platform with visualization technology, serving both enterprises and solution providers.
More information can be found here. Some dashboards examples can be found here.
A short 3-minutes presentation.
More information can be found here. Some dashboards examples can be found here.
A short 3-minutes presentation.
Published in
analytics
Wednesday, 05 April 2017 10:50
Vaadin framework
Vaadin is a Java framework for building modern web applications that look greata and perform well. The core software is free and open source. Programmers can simply work with pure Java code and do not worry about technologies such as JavaScript, HTML and Ajax while coding. Vaadin is a server-centric architecture; that means most logic is processed on the server side.
A dashboard demo is available here.
Vaadin website: vaadin.com. You can also find it on GitHub.
A dashboard demo is available here.
Vaadin website: vaadin.com. You can also find it on GitHub.
Published in
web
Friday, 24 February 2017 16:35
A project to follow
Data Ninja just published on Codecanyon a very interesting collaborative platform for dashboard creation and sharing. Some features:
More informations available here. The product demo is here.
You can start to build your own dashboard.
- Multi tenant – users can set up private account with secure login and password
- Collaboration functionality – invite others by email to collaborate on charts and dashboards
- “My Dashboards” panel – displays all dashboards you develop and maintain and those that you are collaborating on
- Brand new enhanced menu that has thumbnail display of collaborators
More informations available here. The product demo is here.
You can start to build your own dashboard.
Published in
web
Wednesday, 22 February 2017 20:48
Metabase
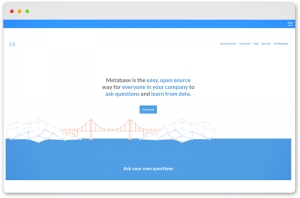
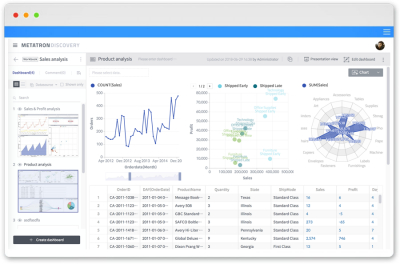
Metabase is a new and interesting project. It is a powerful analytics tool which lets anyone learn and make decisions from their organization’s data. No technical knowledge is required, even if you can also use a SQL query editor to answer to your questions.
Metabase is built and maintained by a dedicated team, and is open source, so the community can help improve it too. You get new features, interface improvements, and bug fixes for free, and can forget about building or maintaining your own analytics platform.
More information on the GitHub page or on the official website.
Published in
analytics
Tuesday, 21 February 2017 07:54
Cyclotron dashboard
Cyclotron is a platform for creating and hosting dashboards, independent of any kind of data source. It permits to load and visualize data without programming skills.
It could be defined as the "CMS of dashboarding". Cyclotron is an open spurce project developed by Expedia Inc., one of the world's leading travel companies. Here at Freney we are testing Cyclotron, to understand if it could be used for our projects. We hope to publish some prototypes in our "playground" section.
More information here. The software can be dounloaded on GitHub.
Published in
analytics
Categories
Search
© 2002 - 2024 Frêney | Freney, S.r.l. - P.Iva: IT03001860166