")
")
Read-IT
An open place to share expertise, information, opinions and insights on new trends in management control, corporate finance, business intelligence, analytics and web development. All screenshots © of their respective owners.
Wednesday, 05 April 2017 12:03
A plugin for sparklines
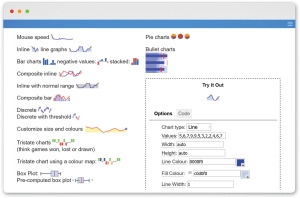
A sparkline is a very small line chart, typically drawn without axes or coordinates. It presents the general shape of the variation (typically over time) in some measurement, such as temperature or stock market price, in a simple and highly condensed way. Sparklines are small enough to be embedded in text, or several sparklines may be grouped together as elements of a small multiple. This is a jQuery plugin to generate sparklines (small inline charts) directly in the browser, using data supplied either inline in the HTML, or via javascript.
The plugin is compatible with most modern browsers and has been tested with Firefox 2+, Safari 3+, Opera 9, Google Chrome and Internet Explorer 6, 7, 8, 9 & 10 as well as iOS and Android.
Last version 2.1.2 was released in June 2013 and can be found here.
The plugin is compatible with most modern browsers and has been tested with Firefox 2+, Safari 3+, Opera 9, Google Chrome and Internet Explorer 6, 7, 8, 9 & 10 as well as iOS and Android.
Last version 2.1.2 was released in June 2013 and can be found here.
Published in
other
Wednesday, 15 March 2017 19:43
Chart.js
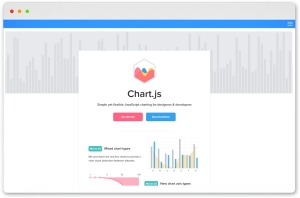
An open source project to display charts on your website. Chart.js is responsive, with a great rendering performance across all modern browsers.
The framework is downloadable here on GitHub. Technical documentation is here.
Chart.js is perfect for small projects, when you need clean, elegant, fast and responsive javascript charts. It is a light open source library at just 11kb when minified and zipped. It includes 8 core chart types, with some animation features.
Published in
web
Wednesday, 05 April 2017 10:10
Amcharts library
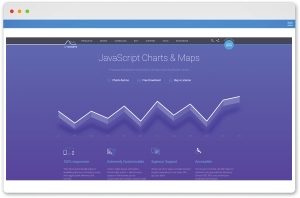
amCharts is a company based in Vilnius, Lithuania. In more than 10 years amCharts developed a very complete and powerful framework for data visualization. Javascript Charts can be used to publish classic charts like Line, Area, Column, Bar, Pie, XY, Scatter, Candlestick and OHLC as well as more “exotic” ones like Gauges, Funnels, GANTT. Javascript Stock Chart can adaptively visualize financial data. Developers can enhance UX by making use of such awesome advanced features as adaptive data granularity, multiple synced panels, data set comparison and many more. Finally, Javascript Maps can add a simple, out-of-the-box beautiful maps on websites. A very complete demo gallery is available here.
AmCharts website: amcharts.com
AmCharts website: amcharts.com
Published in
web
Friday, 24 February 2017 21:41
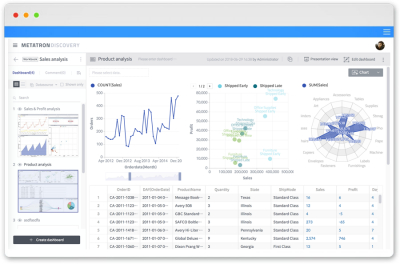
Syncfusion dashboard
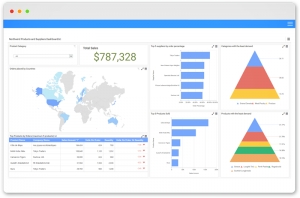
The Syncfusion Dashboard Platform is an end-to-end solution for creating, managing, and sharing interactive professional dashboards.
It includes a powerful dashboard designer client application for easily composing dashboards as well as a web interface for managing and sharing dashboards on-line.
The solution is not open source but the company offers a free community edition to test ad use it in small organizations.
Syncfusion Inc. is a North Carolina company and offers one of the most comprehensive suite of components available for .NET, Javascript, iOS, Android and Xamarin, including grids, diagrams, schedules, gantt controls, maps, gauges, docking, ribbons and much more.
More information here. Information on the community edition.
Published in
analytics
Categories
Search
© 2002 - 2024 Frêney | Freney, S.r.l. - P.Iva: IT03001860166