")
")
Read-IT
An open place to share expertise, information, opinions and insights on new trends in management control, corporate finance, business intelligence, analytics and web development. All screenshots © of their respective owners.
Wednesday, 31 October 2018 09:13
Smashing framework
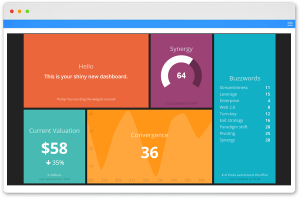
Smashing is a Sinatra based framework, used to build beautiful and impressive dashboards. The project is a fork of Dashing, an excellent framework created by Shopify for displaying custom dashboards on TVs around their offices.
Smashing has a drag & drop interface for re-arranging the widgets positions and many premade widgest, ready to be used. Developers can also build custom widgets, to display data from multiple sources (Simple Ruby DSL for fetching data from databases or online resources).
The official Smashing page is here →.
Here is a live demo → of a simple dashboard with realtime update. You can host your Smashing dashboards on Heroku in less than 30 seconds.
Published in
controlling
Friday, 19 October 2018 09:08
Grafana dashboards
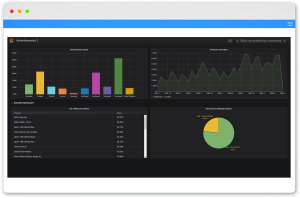
Grafana provides a powerful and elegant way to create, explore, and share dashboards and data with teams and on the world wide web. It is most commonly used for visualizing time series data but many use it in other domains including business analytics, industrial sensors, weather forecasting and process control.
Grafana works with Graphite, Elasticsearch, Cloudwatch, Prometheus, InfluxDB & many more data sets, included MySQL, PostgreSQL, Microsoft SQL Server, etc. Grafana is open source software, but if offers some commercial plugins to add some useful features.
More info here.
Grafana works with Graphite, Elasticsearch, Cloudwatch, Prometheus, InfluxDB & many more data sets, included MySQL, PostgreSQL, Microsoft SQL Server, etc. Grafana is open source software, but if offers some commercial plugins to add some useful features.
More info here.
Published in
controlling
Wednesday, 05 April 2017 10:10
Amcharts library
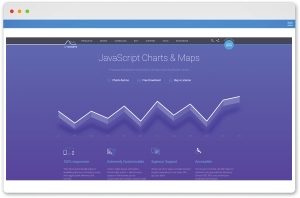
amCharts is a company based in Vilnius, Lithuania. In more than 10 years amCharts developed a very complete and powerful framework for data visualization. Javascript Charts can be used to publish classic charts like Line, Area, Column, Bar, Pie, XY, Scatter, Candlestick and OHLC as well as more “exotic” ones like Gauges, Funnels, GANTT. Javascript Stock Chart can adaptively visualize financial data. Developers can enhance UX by making use of such awesome advanced features as adaptive data granularity, multiple synced panels, data set comparison and many more. Finally, Javascript Maps can add a simple, out-of-the-box beautiful maps on websites. A very complete demo gallery is available here.
AmCharts website: amcharts.com
AmCharts website: amcharts.com
Published in
web
Friday, 24 February 2017 21:19
Razorflow
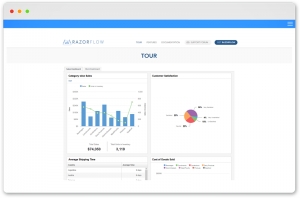
An html5 open source dashboard framework. It's a mature solution with many features and well documented. Here the main features:
Complete set of dashboard elements
Includes all the components that you need to build dashboards in a single package.
Light and Fast
Built with mobile devices in mind, RazorFlow Dashboard Framework is engineered for the fastest load times.
Full-featured charting
Supports Industry-Standard Column, Pie, Bar, Line charts and more.
Real-time updates
Dashboards can be updated in real-time without having to reload the page, and are compatible with web sockets.
Powerful theme-builder
The theme-builder allows you to change the look of your dashboard in just a few clicks.
Built for touch
All dashboards work great on touch devices like smartphones and tablets, with no extra work.
Server-side wrappers
Build complete interactive dashboards in PHP with no JavaScript or HTML coding required.
Embed and integrate
Embed dashboards into existing pages and web applications, and integrate fully using a JavaScript API.
Razorflow has a well-designed set of APIs to build your first HTML5 dashboard in under an hour, which works across platforms and devices. A comprehensive documentation, pre-build dashboards and an extensive feature gallery help you get started fast.
More details here. The source code can be downloaded for free here.
Published in
web
Categories
Search
© 2002 - 2024 Frêney | Freney, S.r.l. - P.Iva: IT03001860166