")
")
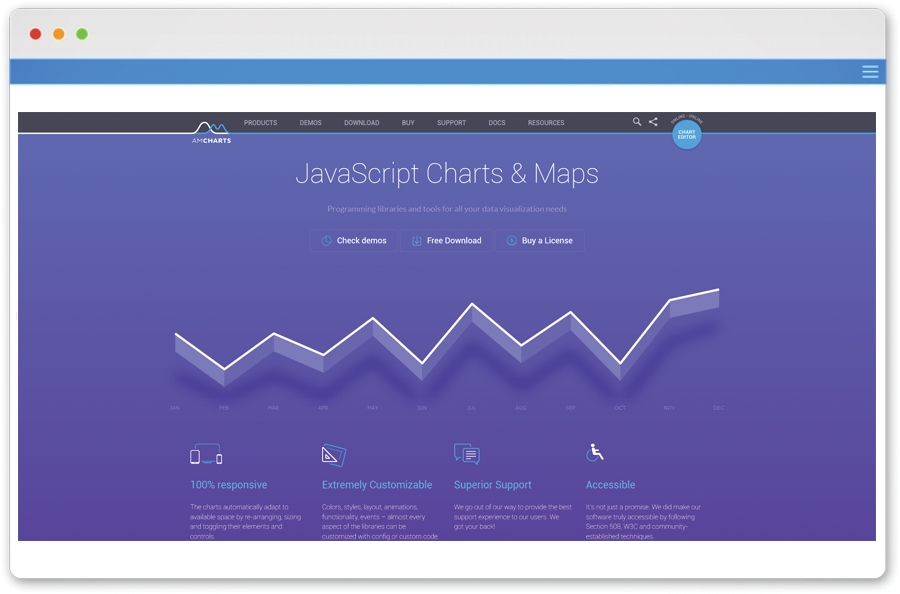
amCharts is a company based in Vilnius, Lithuania. In more than 10 years amCharts developed a very complete and powerful framework for data visualization. Javascript Charts can be used to publish classic charts like Line, Area, Column, Bar, Pie, XY, Scatter, Candlestick and OHLC as well as more “exotic” ones like Gauges, Funnels, GANTT. Javascript Stock Chart can adaptively visualize financial data. Developers can enhance UX by making use of such awesome advanced features as adaptive data granularity, multiple synced panels, data set comparison and many more. Finally, Javascript Maps can add a simple, out-of-the-box beautiful maps on websites. A very complete demo gallery is available here.
AmCharts website: amcharts.com
Read-IT
An open place to share expertise, information, opinions and insights on new trends in management control, corporate finance, business intelligence, analytics and web development. All screenshots © of their respective owners.
Categories
Search

© 2002 - 2026 Frêney | Freney, S.r.l. - P.Iva: IT03001860166